Devil’s Gate Reservoir Restoration Project

Air Quality Monitoring Program

Welcome to the LA County Public Works Devil’s Gate Reservoir Restoration Project air quality monitoring website. As part of the restoration project, LA County Public Works is operating an air quality monitoring network that collects continuous data on ambient air quality and meteorological conditions in the Devil’s Gate Reservoir project site.

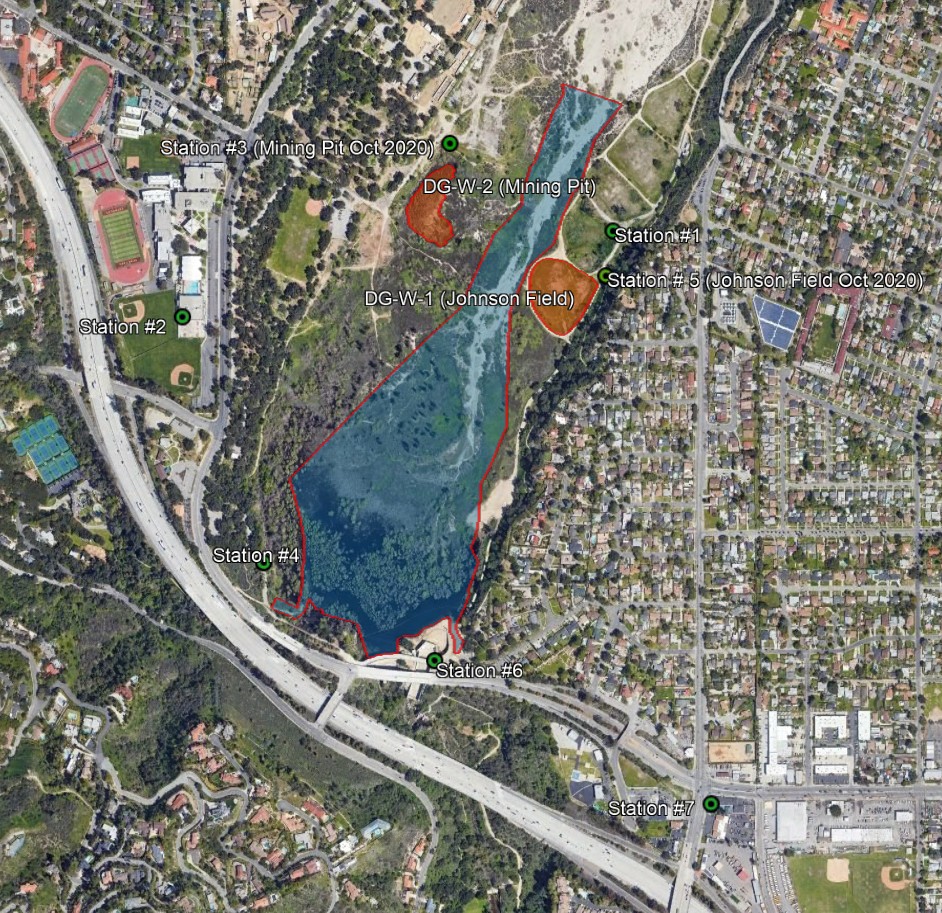
A total of six monitoring stations are strategically located within and surrounding the restoration project site for compliance purposes and to monitor potential air quality impacts resulting from the restoration project. The table below provides a summary of the monitoring stations and types of air pollutants being monitored. As noted in the table, there are two types of monitoring stations:

  1. Ambient/Community - The purpose of these monitoring stations is to collect data within the community areas near the project perimeter.
  2. Compliance – These monitoring stations are placed within the project area and collect data to ensure the sediment removal activities are in compliance with Rule 403 for fugitive dust.
All the air monitoring stations locations were approved by LA County Public Works, California Air Resources Board, South Coast Air Quality Management District, and the local community group. Each monitoring station collects real-time measurements for various pollutants including ozone (O3), particulate matters (PM10 and PM2.5), and nitrogen dioxide (NO2). Blackcarbon (BC) measurements will also be collected at each of the ambient/community monitoring stations.

Station ID
Sampling Station Type
Parameter Measured
Comments
1
Ambient/Community Monitoring
  • PM10, PM2.5, and BC
  • NO2 and O3
  • Wind speed, wind direction, temperature, humidity
Downwind of Site (mornings);
Upwind (evenings)
2
Ambient/Community Monitoring
  • PM10, PM2.5, and BC
  • NO2 and O3
  • Wind speed, wind direction, temperature, humidity
Upwind of Site (mornings);
Downwind (evenings)
3
Compliance Monitoring
  • PM10 and PM2.5
  • NO2 and O3
  • Wind speed, wind direction, temperature, humidity
West side of site fence line monitoring
4
Compliance Monitoring
  • PM10 and PM2.5
  • NO2 and O3
  • Wind speed, wind direction, temperature, humidity
Southwest side of sediment removal area to monitor project and freeway emissions
5
Compliance Monitoring
  • PM10 and PM2.5
  • NO2 and O3
  • Wind speed, wind direction, temperature, humidity
East side of site fence line monitoring, west of residential area
6
Ambient/Community Monitoring
  • PM10, PM2.5, and BC
  • NO2 and O3
  • Wind speed, wind direction, temperature, humidity
Truck route monitoring southwest of residential area.
Upwind of Site (mornings); Downwind (evenings)
7
Ambient/Community Monitoring
  • PM10, PM2.5, and BC
  • NO2 and O3
  • Wind speed, wind direction, temperature, humidity
Truck route monitoring southeast of removal area. Upwind of Site (mornings); Downwind (evenings)

The air quality monitoring data collected from the monitoring stations will be used to better manage and provide feedback to LA County Public Works to implement best management practices and emission mitigation measures to reduce potential negative environmental and public health impacts by the restoration project.

The real-time monitoring data collected from the monitoring stations are available for public viewing. The data can be viewed through the following links:

Presents real-time (one-hour average) preliminary air quality data for each air pollutant and meteorological information measured at each location. It should be noted these data have not been validated and may be subject to change/modification based on professional review.
This link will take you to the location on LA County Public Works Devil’s Gate Restoration Project webpage that hosts the daily air monitoring reports.